The wealthy nations of the world are responsible for most carbon emissions.
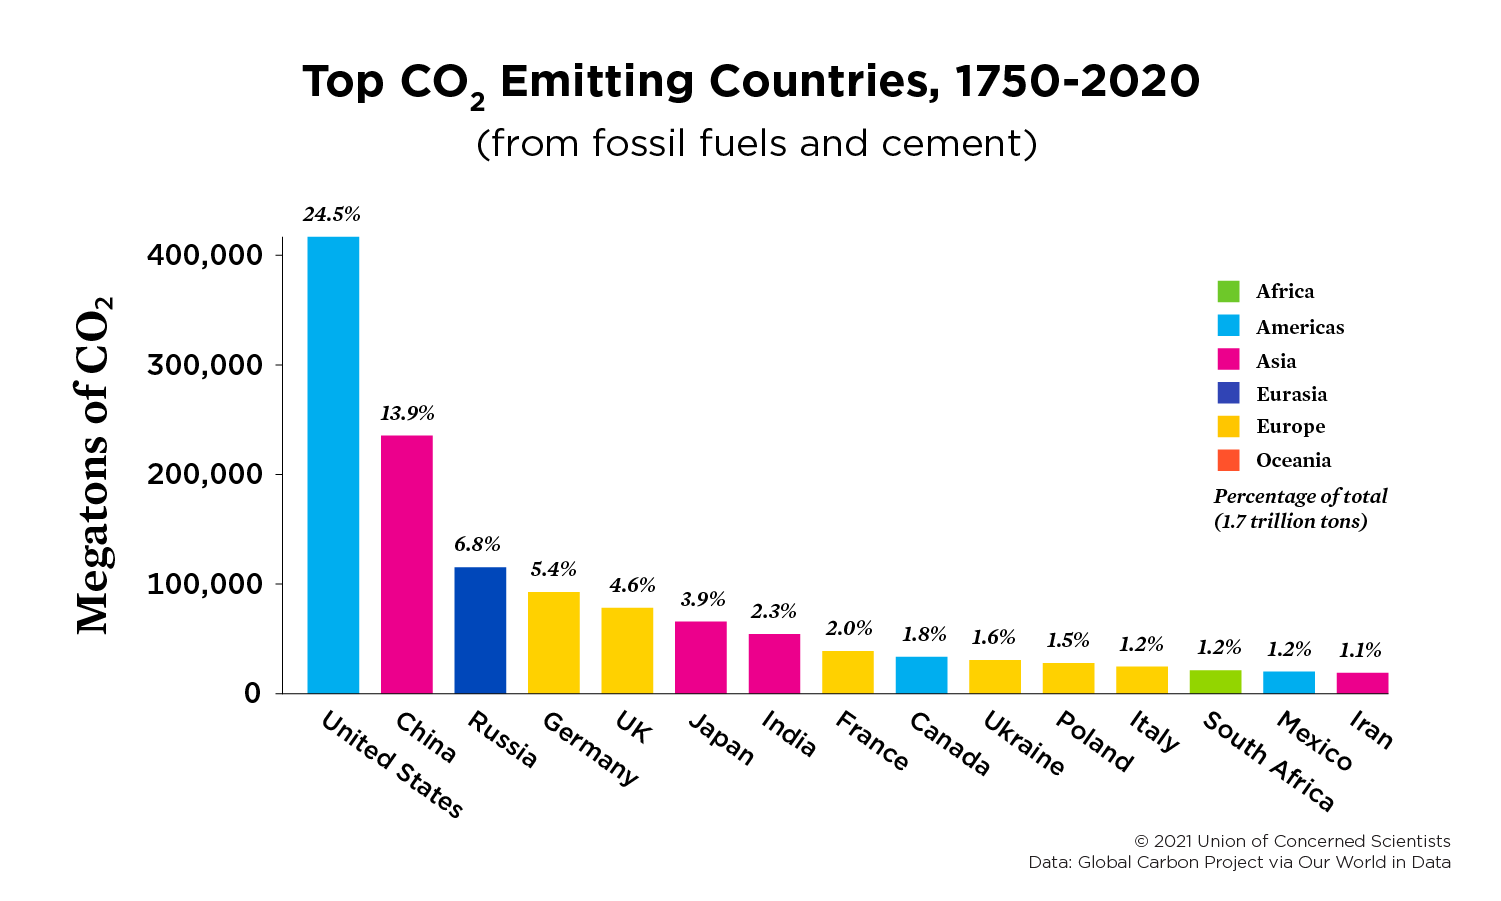
Cumulative carbon dioxide emissions are the dominant driver of climate change. These began rising during the Industrial Revolution (especially after 1850)—which means richer countries like the United States, which made an early transition to a heavily fossil fuel-based economic system, have an outsized role in contributing to the climate impacts we see around the world today.
Both in terms of cumulative emissions, and current per capita emissions, richer countries rank high. Conversely, low- and middle-income countries have lower cumulative historical emissions and per capita emissions. Even within countries, it is the relatively rich that are most responsible for a majority of carbon emissions.
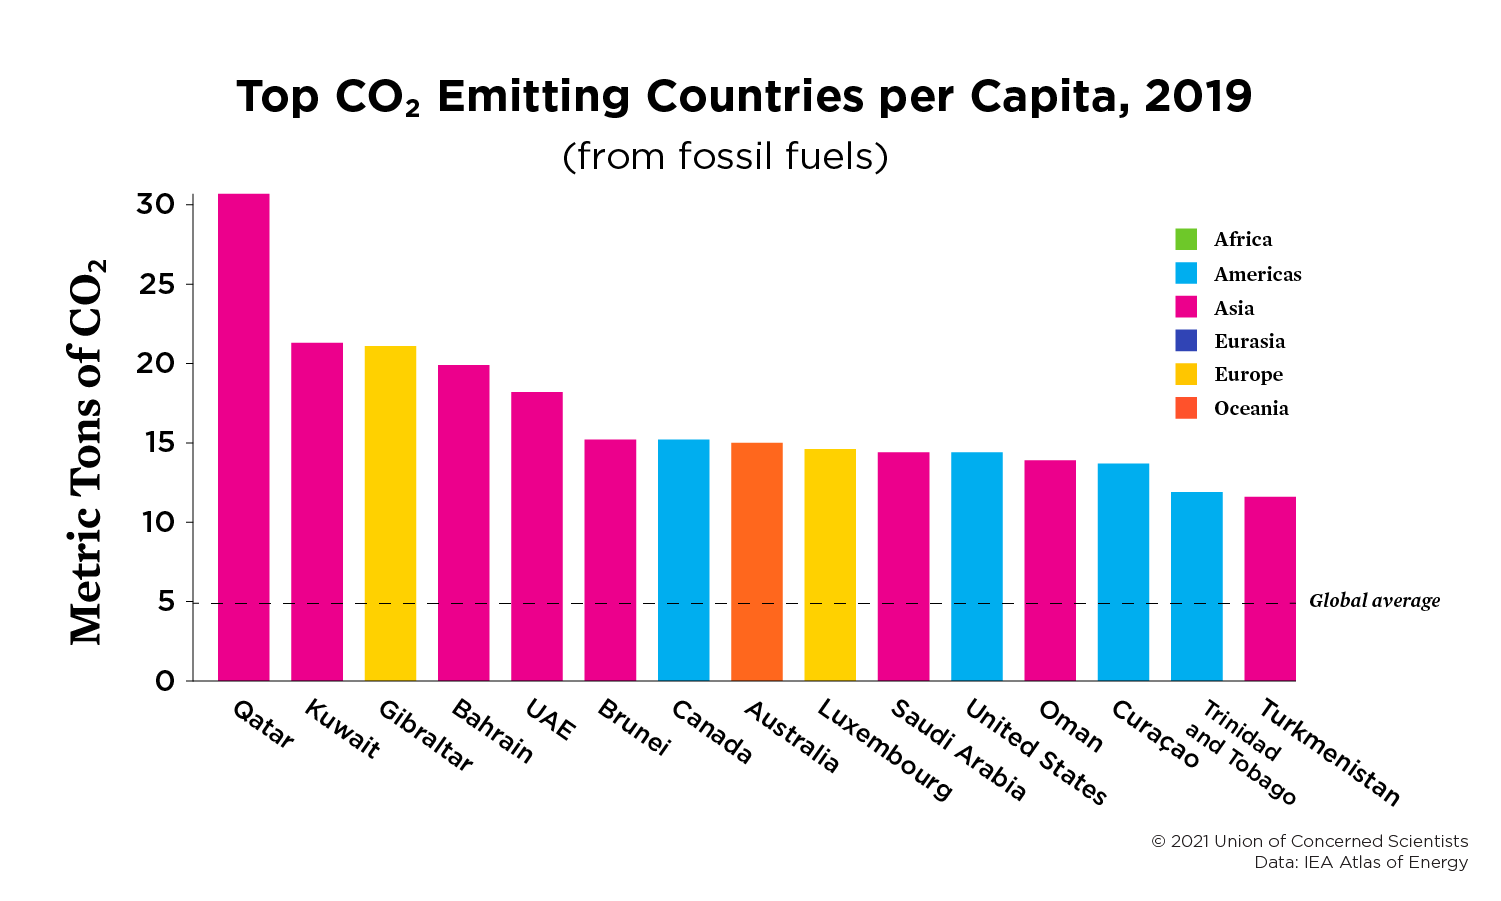
The rankings above change when we account for the population of each country (ie, per capita emissions), or when we change the timeframe.
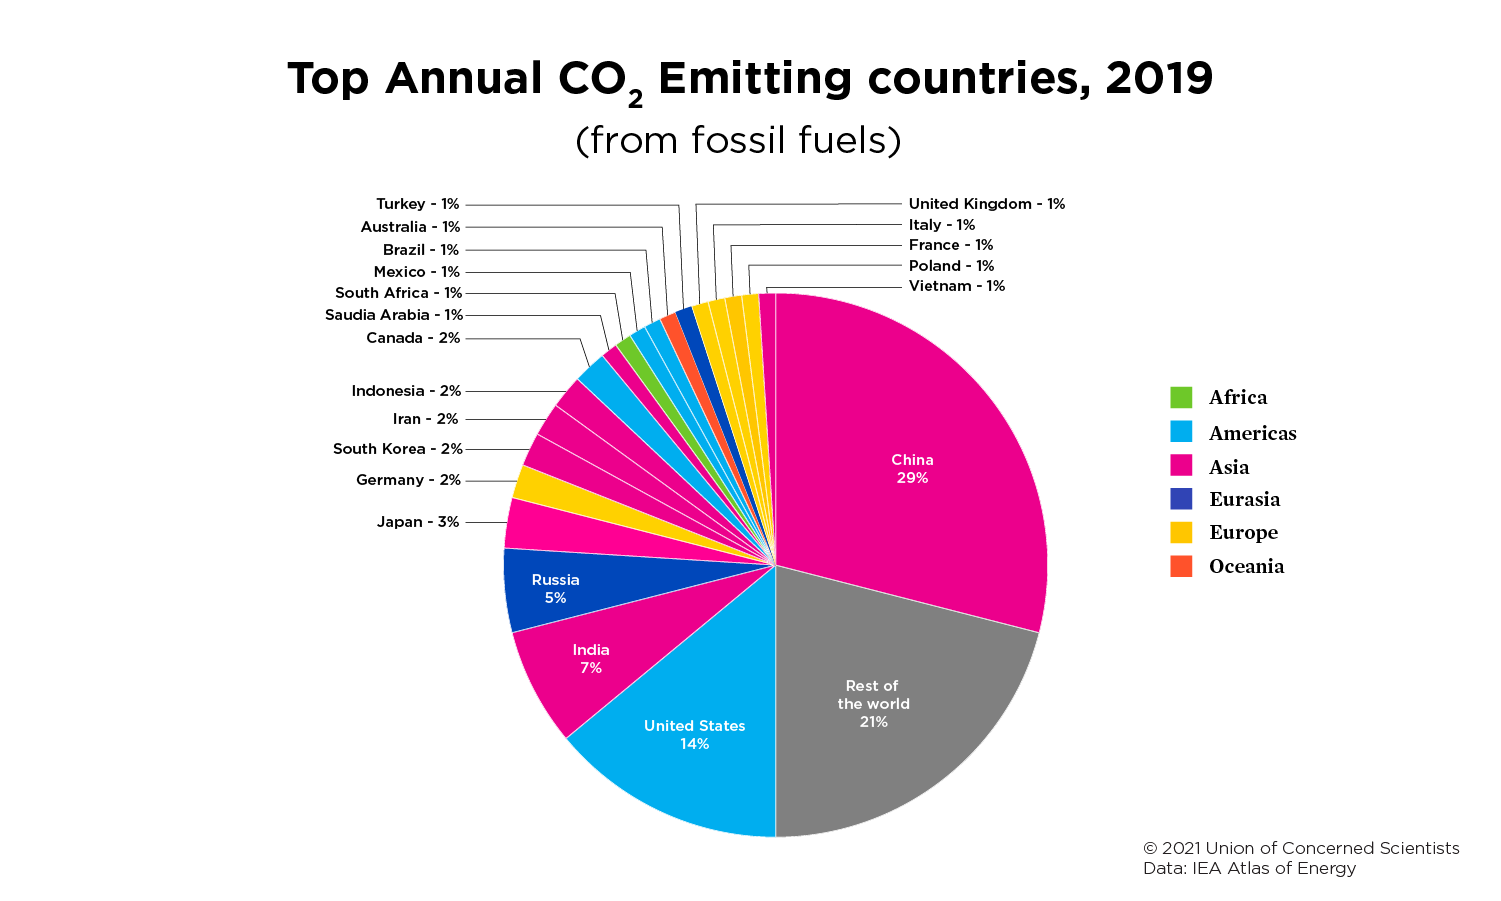
The picture that emerges from these figures is one where—in general—developed countries and major emerging economy nations lead in total carbon dioxide emissions.
However, developed nations typically have high carbon dioxide emissions per capita, while some developing countries lead in the growth rate of carbon dioxide emissions. These uneven contributions to the climate crisis are at the core of the challenges the world community faces in finding effective and equitable solutions to global warming.
2019 rankings by per capita emissions
Related resources

Saving Endangered Species: Turtle by Turtle
The Case Against ExxonMobil, Chevron, and other Fossil Fuel Companies

Is Capturing and Storing CO2 Emissions a Viable Climate Solution?